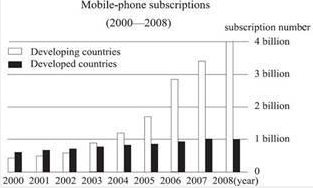
In this section, you are asked to write an essay based on the following chart. In your writing, you should interpret the chart, and give your comments. You should write at least 150 words. Write your essay on the ANSWER SHEET 2.

正确答案及解析
正确答案
解析
This bar chart shows mobilephone subscriptions in developing countries and developed countries,measured in billions,for the years 2000 to 2008.The mobilephone subscriptions in both developing countries and developed countries enjoyed increase in different speed over time.In this chart,the mobilephone subscription in developed countries maintained a continual and steady increase from 2000 to 2007 and remained constant in 2008.Meanwhile,the mobilephone subscription in developing countries have undergone a slow increase from 2000 to 2004 and then saw a great surge from 2005 to 2007.This trend increased to a peak about 4 billion in 2008.Based on different national situations,the reasons leading to this trend can be summarized into two points.First,the developed countries have a limited number of population,which decides that the demand for mobilephone service is also limited and will soon be saturated.Second,as for the developing countries,it has a large population and also a large demand for mobilephone service.And as the mobilephone becomes more available and more affordable,there is an increasing number of people buying their mobilephones.In my view,this trend that the number of mobilephone subscription continues to grow in developing countries will be constant for a while in the future.And this trend would also benefit most of the mobile users both in the developing countries and developed countries.


